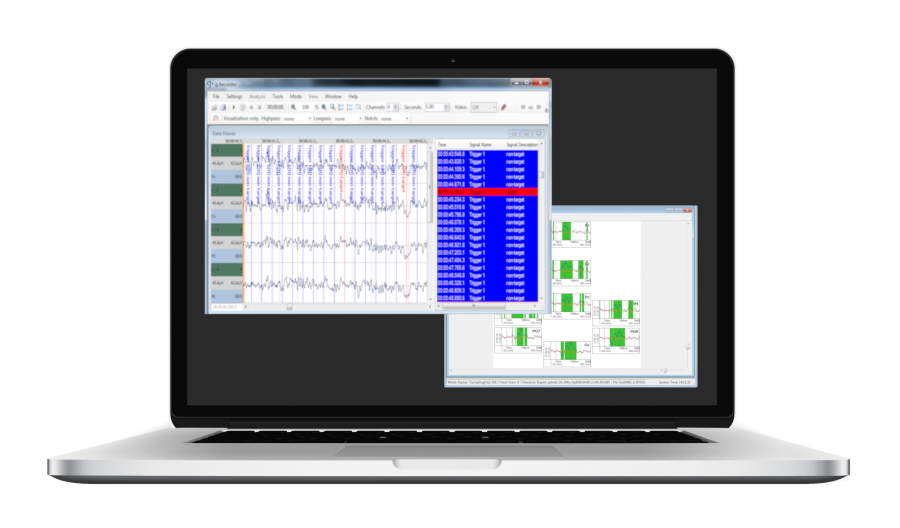
g.Recorder supports all g.tec biosignal acquisition devices and provides tools for easy configuration and setup, data visualization, storage, and review. Signals and parameters can be checked in the display mode, stored to disk, and later reviewed in the offline/replay mode. With the Professional version of g.Recorder, video data can also be stored simultaneously with the biosignals, and the following parameters can be computed online:
- CSA: Compressed Spectral Array (explorative analysis of signal properties and data quality for long-term recordings)
- HR: Heart Rate (based on automatic R-peak detection from the ECG raw signal)
- HRV: Heart Rate Variability (HR and HRV parameters reflect the state of the autonomous nervous system)
- EP: Online EP calculation with statistical analysis
The Professional version also adds monitoring of Cerebral Function/aEEG (amplitude integrated EEG) with automatic pattern classification. This is used to monitor the ongoing brain functions of premature infants in the neonatal intensive care unit. In addition to the online classification, there is also an offline CFM-toolbox available, as a part of g.BSanalyze (g.tec’s biosignal analysis software package).
| Support for g.tec biosignal amplifiers g.USBamp, g.HIamp and g.Nautilus |
| Multimodal biosignal visualization and recording |
| Synchronized storage of biosignal data, triggers and video |
| Configuration and setup of hardware parameters |
| Storage of header information and subject/patient data |
| User/Admin mode for save operation |
| Intelligent file management and search functions |
| Stand-alone program |
| Real-time EP calculation with statistical analysis |
| Online filters for visualization |
| Load topographic information for result presentation |
EEG AND TMS
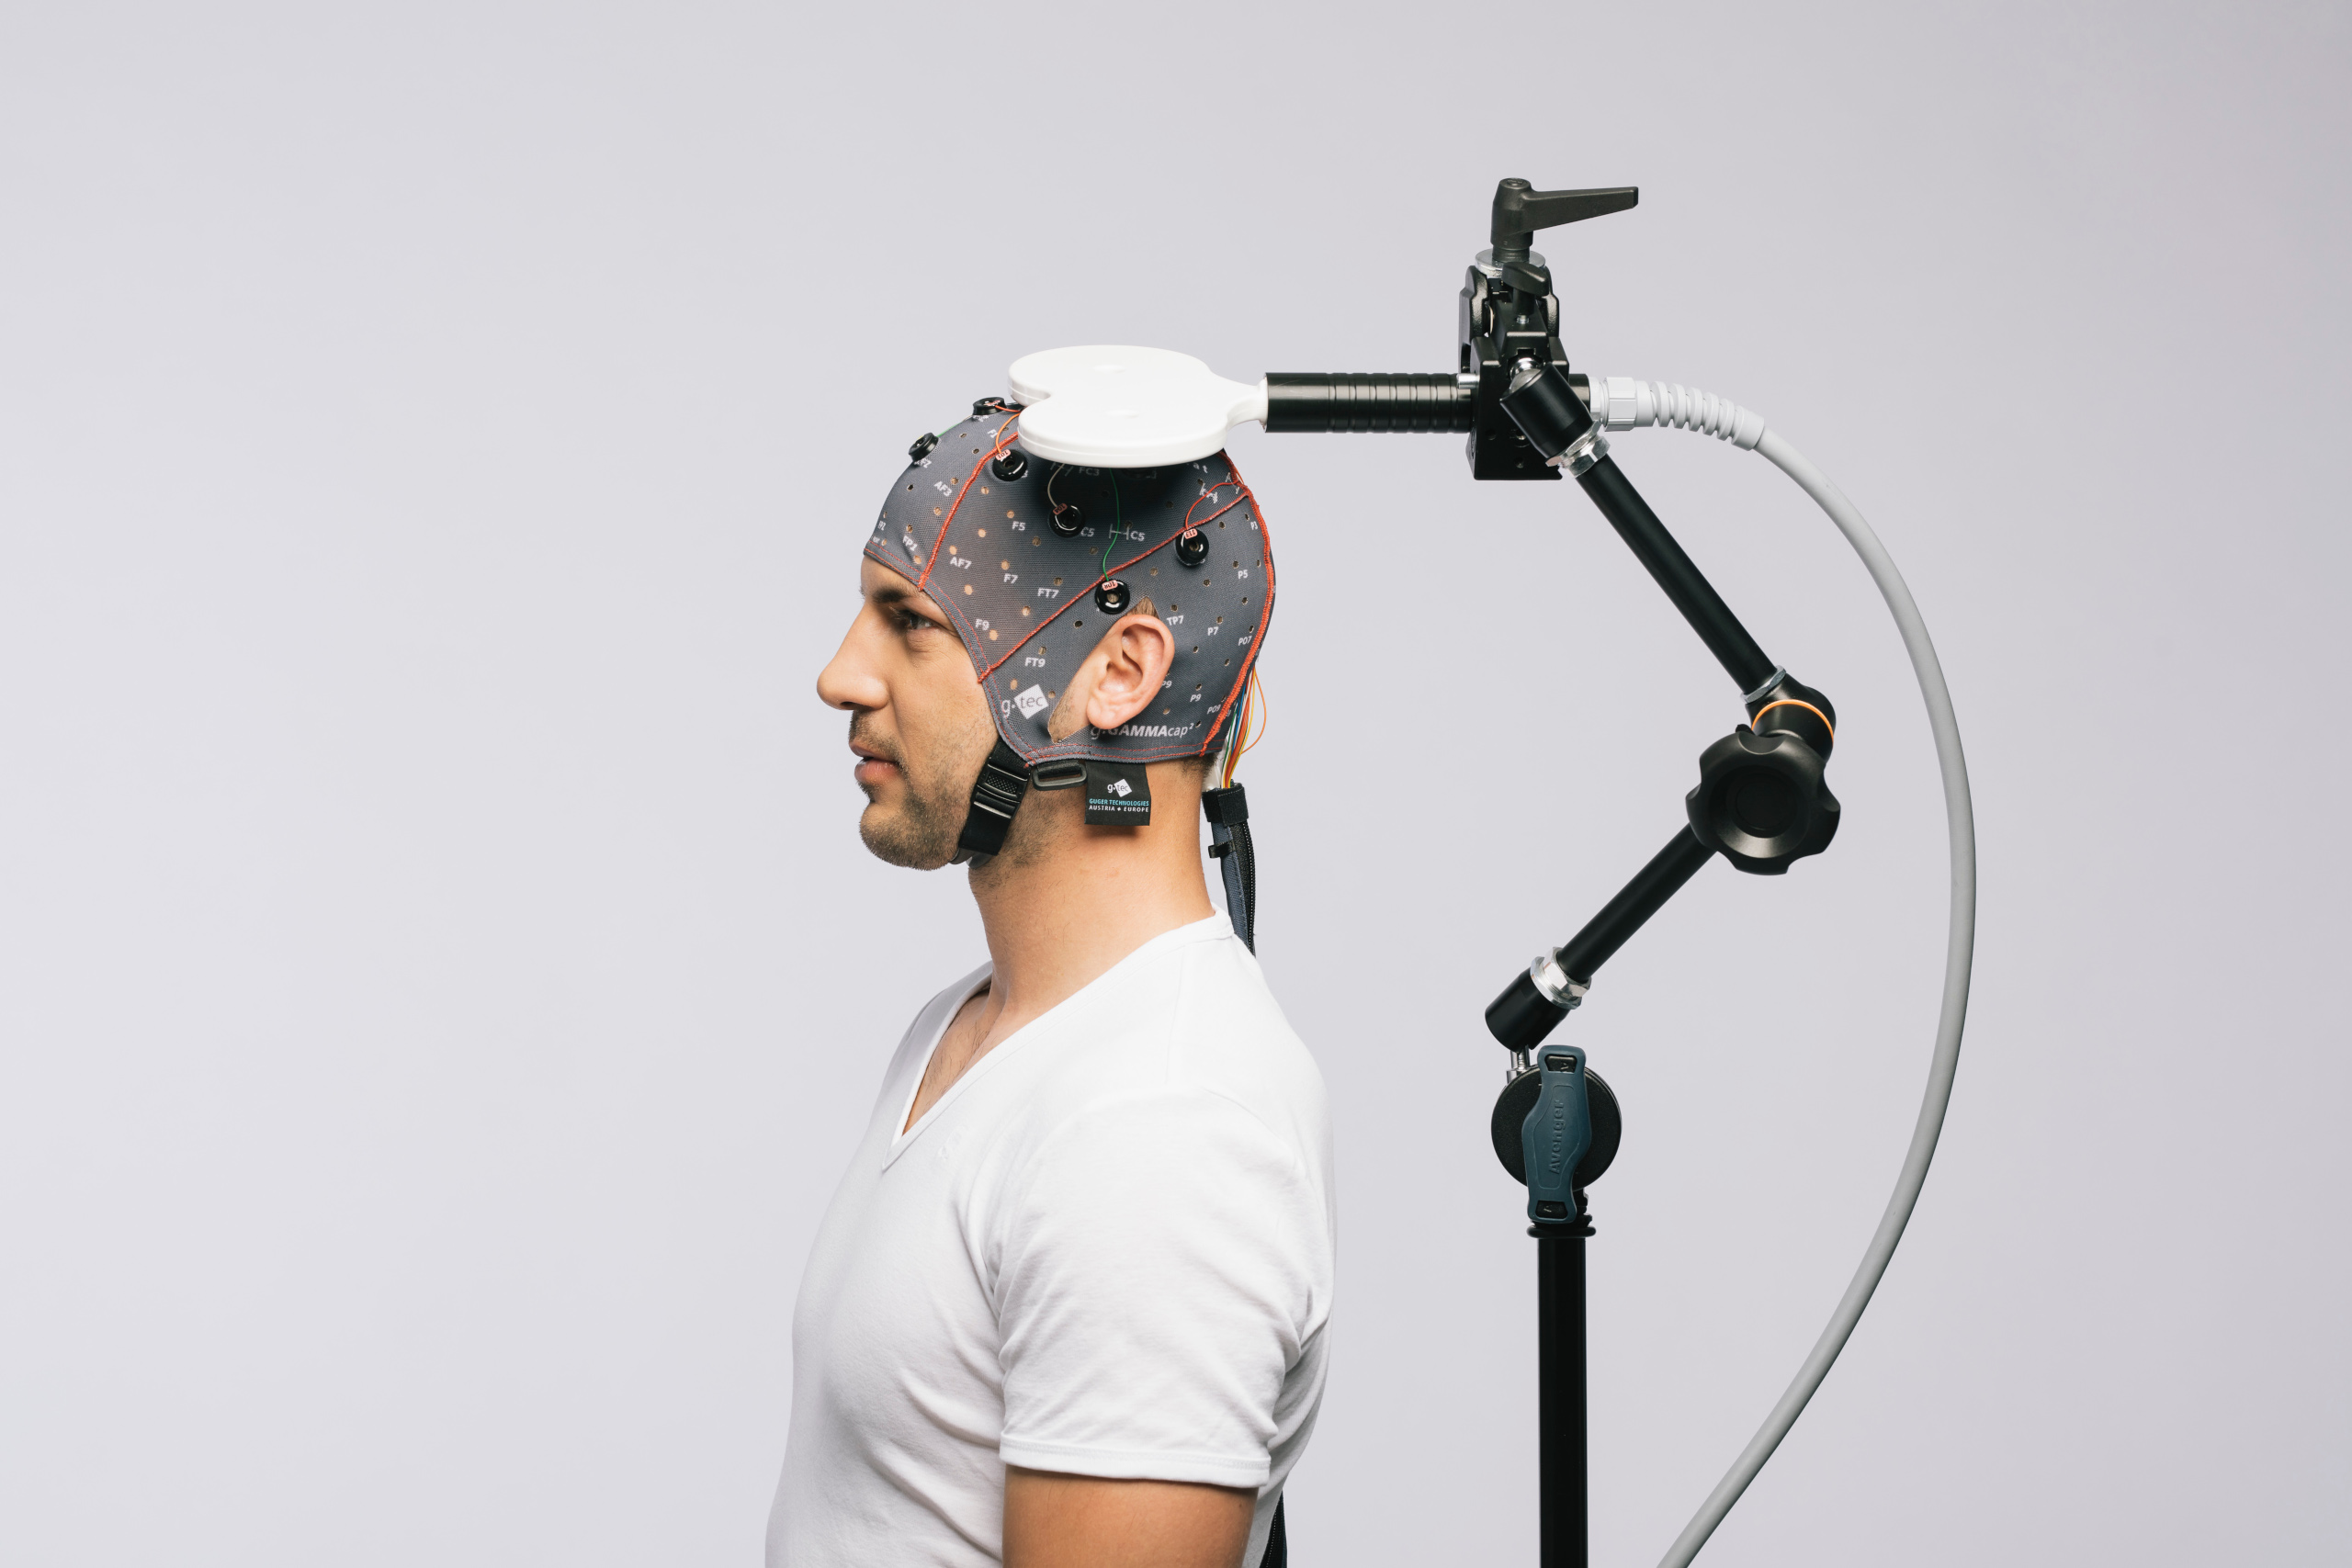
An important application is the recording of EEG activity while a patient receives TMS (transcranial magnetic stimulation) pulses. For example, the TMS coil may positioned over the motor cortex to generate a finger movement, which leads to an SEP in the EEG.
g.Recorder allows you to select a high sampling frequency of all the EEG channels and acquire the data without filtering. Furthermore, the exact timing of the TMS pulse can be read in via the TTL inputs of the amplifier. After the recording, ERPs can be calculated and artifact removal algorithms can be applied to get clean EEG data and study the effect of the TMS stimulation.

COMPATIBILITY WITH g.NAUTILUS WIRELESS EEG SYSTEMS
g.Recorder now supports data acquisition from the variety of available g.Nautilus wireless EEG amplifiers. This includes display, processing, recording and review (depending on the purchased g.Recorder extensions) of EEG signals measured by the wireless headset and the additional channels provided, like acceleration data.
Impedance measurement can be performed for the analogue EEG channels, and the base station’s digital inputs can be fed in as trigger channels.

G.TEC SUITE 2020
The g.tec Suite 2020 contains all software packages from g.tec, such as g.NEEDaccess with all APIs, g.HIsys, g.Recorder and g.BSanalyze. It allows an easy installation, update and organization of all software packages, and comes with an automatic software compatibility check to minimize any software issues on your computer.


BASIC 950,00 €
Buy with a g.HIamp, g.Nautilus or g.USBamp to save 5%
- Data acquisition from g.HIamp, g.USBamp and g.Nautilus
- High-speed data visualization
- Data storage in HDF5 format
- Selection of sampling frequencies up to 38.4kHz, recording channels, bandpass and Notch filters
- Visualization filters (bandpass, Notch)
- Impedance check
- Onboarding

PROFESSIONAL 2.950,00 €
Buy with a g.HIamp, g.Nautilus or g.USBamp to save 10%
- Data acquisition from g.HIamp, g.USBamp and g.Nautilus
- High-speed data visualization
- Data storage in HDF5 format
- Review mode
- Selection of sampling frequencies up to 38.4kHz, recording channels, bandpass and Notch filters
- Visualization filters (bandpass, Notch)
- Impedance check
- Onboarding
- Video
- Evoked potentials
- Heart-rate and heart-rate variability
- Cerebral function analysis
EVOKED POTENTIAL VIEWER
The Evoked Potentials viewer provides a convenient way to display evoked potentials. The viewer displays averaged data frames for each acquired analog input channel. An evoked potentials plot is created for each acquired channel. The time frame represents a defined time period, consisting of a pre-trigger period, a post-trigger offset and a post trigger period. The viewer can display the trigger appearance and an averaged time frame for target and non-target evoked potentials. Significant differences between target and non-target evoked potentials can be calculated and highlighted.
RAW DATA VISUALIZATION AND STORAGE
g.Recorder allows a fast and ultra-precise visualization of biosignal data with up to 38.4 kHz. Beside the biosignal data, markers can be recorded to indicate trigger time points. The software allows recordings of region markers that indicate the beginning and the end of an event. The data is stored in HDF5 format which can be imported into g.BSanalyze or MATLAB. The software comes also with the Montage Creator to define electrodes positions and to measure exact electrodes positions with e.g. a Polhemus.

NEED MORE INFORMATION
ABOUT THIS PRODUCT?
Send us your email so we can contact you as soon as possible.


