

FROM RAW BIOSIGNALS TO SCIENTIFIC RESULTS
g.BSanalyze is a comprehensive offline analysis environment for EEG, ECoG, ECG, EMG, EOG, spike and multimodal biosignal data. As the offline analysis layer of the g.tec neuroscience software ecosystem, it takes recorded biosignals from preprocessing and artifact correction through feature extraction, classification, statistical analysis and scientific visualization.
Use more than 100 functions across the time, frequency and spatial domains, analyze data interactively through the graphical user interface, or automate reproducible workflows with MATLAB-based batch processing. Specialized toolboxes extend g.BSanalyze for EEG, ECoG, CCEP, ECG, high-resolution EEG, cerebral function analysis, spike analysis and classification.
- EEG & ECoG Analysis: ERP, ERD/ERS, spectral analysis, coherence, time-frequency analysis and more.
- Artifact Correction: OSCAR PRO, ICA, spatial filters, automatic artifact detection and TMS artifact removal.
- BCI & Classification: Analyze P300, SSVEP/SSSEP, motor imagery, cVEP and slow cortical potential paradigms.
- Automated Workflows: Save processing steps and apply them automatically to multiple datasets using batch processing.
g.BSanalyze supports data recorded with g.Recorder, g.HIsys and supported third-party acquisition systems, allowing researchers to bring existing recordings into the same offline analysis workflow. Import supported formats including MATLAB, EDF, ASCII, CNT, BIOPAC, BioSemi, Micromed and cortiQ data, then apply g.BSanalyze preprocessing, artifact correction, feature extraction, statistical analysis, classification and visualization tools.
| EEG & ECoG Analysis | Analyze non-invasive EEG and invasive ECoG data with dedicated preprocessing, feature extraction and analysis tools. |
| OSCAR PRO Artifact Correction | Correct artifacts in recorded EEG data with OSCAR PRO, alongside ICA, spatial filtering and automatic artifact detection. |
| ERP & ERD/ERS Analysis | Analyze evoked potentials, ERPs, ERD/ERS, coherence, phase-locking, spectral activity and time-frequency responses. |
| EEG-TMS Analysis | Process TMS-EEG recordings with dedicated TMS discharge artifact removal and subsequent EEG analysis. |
| BCI Analysis | Analyze P300, motor imagery, SSVEP/SSSEP, cVEP and slow cortical potential paradigms. |
| Feature Extraction & Classification | Extract signal parameters and apply linear and nonlinear classification methods for BCI and neuroscience research. |
| Multimodal Biosignal Analysis | Analyze EEG alongside ECG, EMG, EOG, spikes and other physiological signals within one environment. |
| 2D & 3D Visualization | Create topographies, analysis plots, realistic head-model mappings and publication-ready scientific figures. |
| MATLAB & Batch Processing | Integrate custom MATLAB algorithms, save processing workflows and automatically process multiple datasets. |
| Broad Data Compatibility | Analyze data recorded with g.Recorder, g.HIsys and supported third-party systems, with import support for MATLAB, EDF, ASCII, CNT, BIOPAC, BioSemi, Micromed, cortiQ and additional supported formats. |
| Software Type | Offline biosignal analysis and processing environment |
| Supported Biosignals | EEG, ECoG, EOG, EMG, ECG, spikes and physiological data |
| Analysis Domains | Time, frequency and spatial domains |
| Artifact Processing | OSCAR PRO, ICA, spatial filtering, automatic artifact epoch detection, signal quality checks and TMS discharge artifact removal |
| EEG Analysis | ERP/EP, ERD/ERS, coherence, event-related coherence, time-frequency analysis, CSP, phase-locking value, spectral analysis and statistical comparison |
| BCI Paradigms | P300, motor imagery, SSVEP/SSSEP, cVEP and slow cortical potentials |
| Classification | LDA, SVM, neural networks, radial basis functions, K-means clustering and additional linear and nonlinear methods |
| Visualization | 2D and 3D result visualization, topographies, layout editing and realistic head-model mapping |
| Automation | Batch processing, Automated Batch Starter and automatic journal generation |
| Programming & Customization | MATLAB integration and support for custom algorithms and additional MATLAB toolboxes |
| Standalone Operation | Standalone version available without MATLAB; MATLAB command-window batch processing requires MATLAB |
| Data Sources | g.Recorder, g.HIsys, MATLAB and supported third-party recording systems |
| Import Formats | MATLAB, EDF, ASCII, CNT, BIOPAC, BioSemi, Micromed, cortiQ and additional supported formats |
| Specialized Toolboxes | EEG, ECoG, CCEP, ECG, Classification, High-Resolution EEG, Cerebral Function Analysis and Spike |
MORE THAN 100 FUNCTIONS FOR BIOSIGNAL ANALYSIS
From preprocessing to scientific visualization, g.BSanalyze provides more than 100 functions for offline EEG, ECoG and multimodal biosignal analysis. Define electrode montages, design temporal and spatial filters, assess signal quality, correct artifacts, and perform spectral, coherence, correlation, bandpower, ERP/EP and ERD/ERS analyses within one environment.
Dedicated tools support major BCI paradigms including P300, SSVEP/SSSEP, cVEP, motor imagery and slow cortical potentials. Save your preferred processing steps and apply them consistently across multiple datasets using automated batch processing.
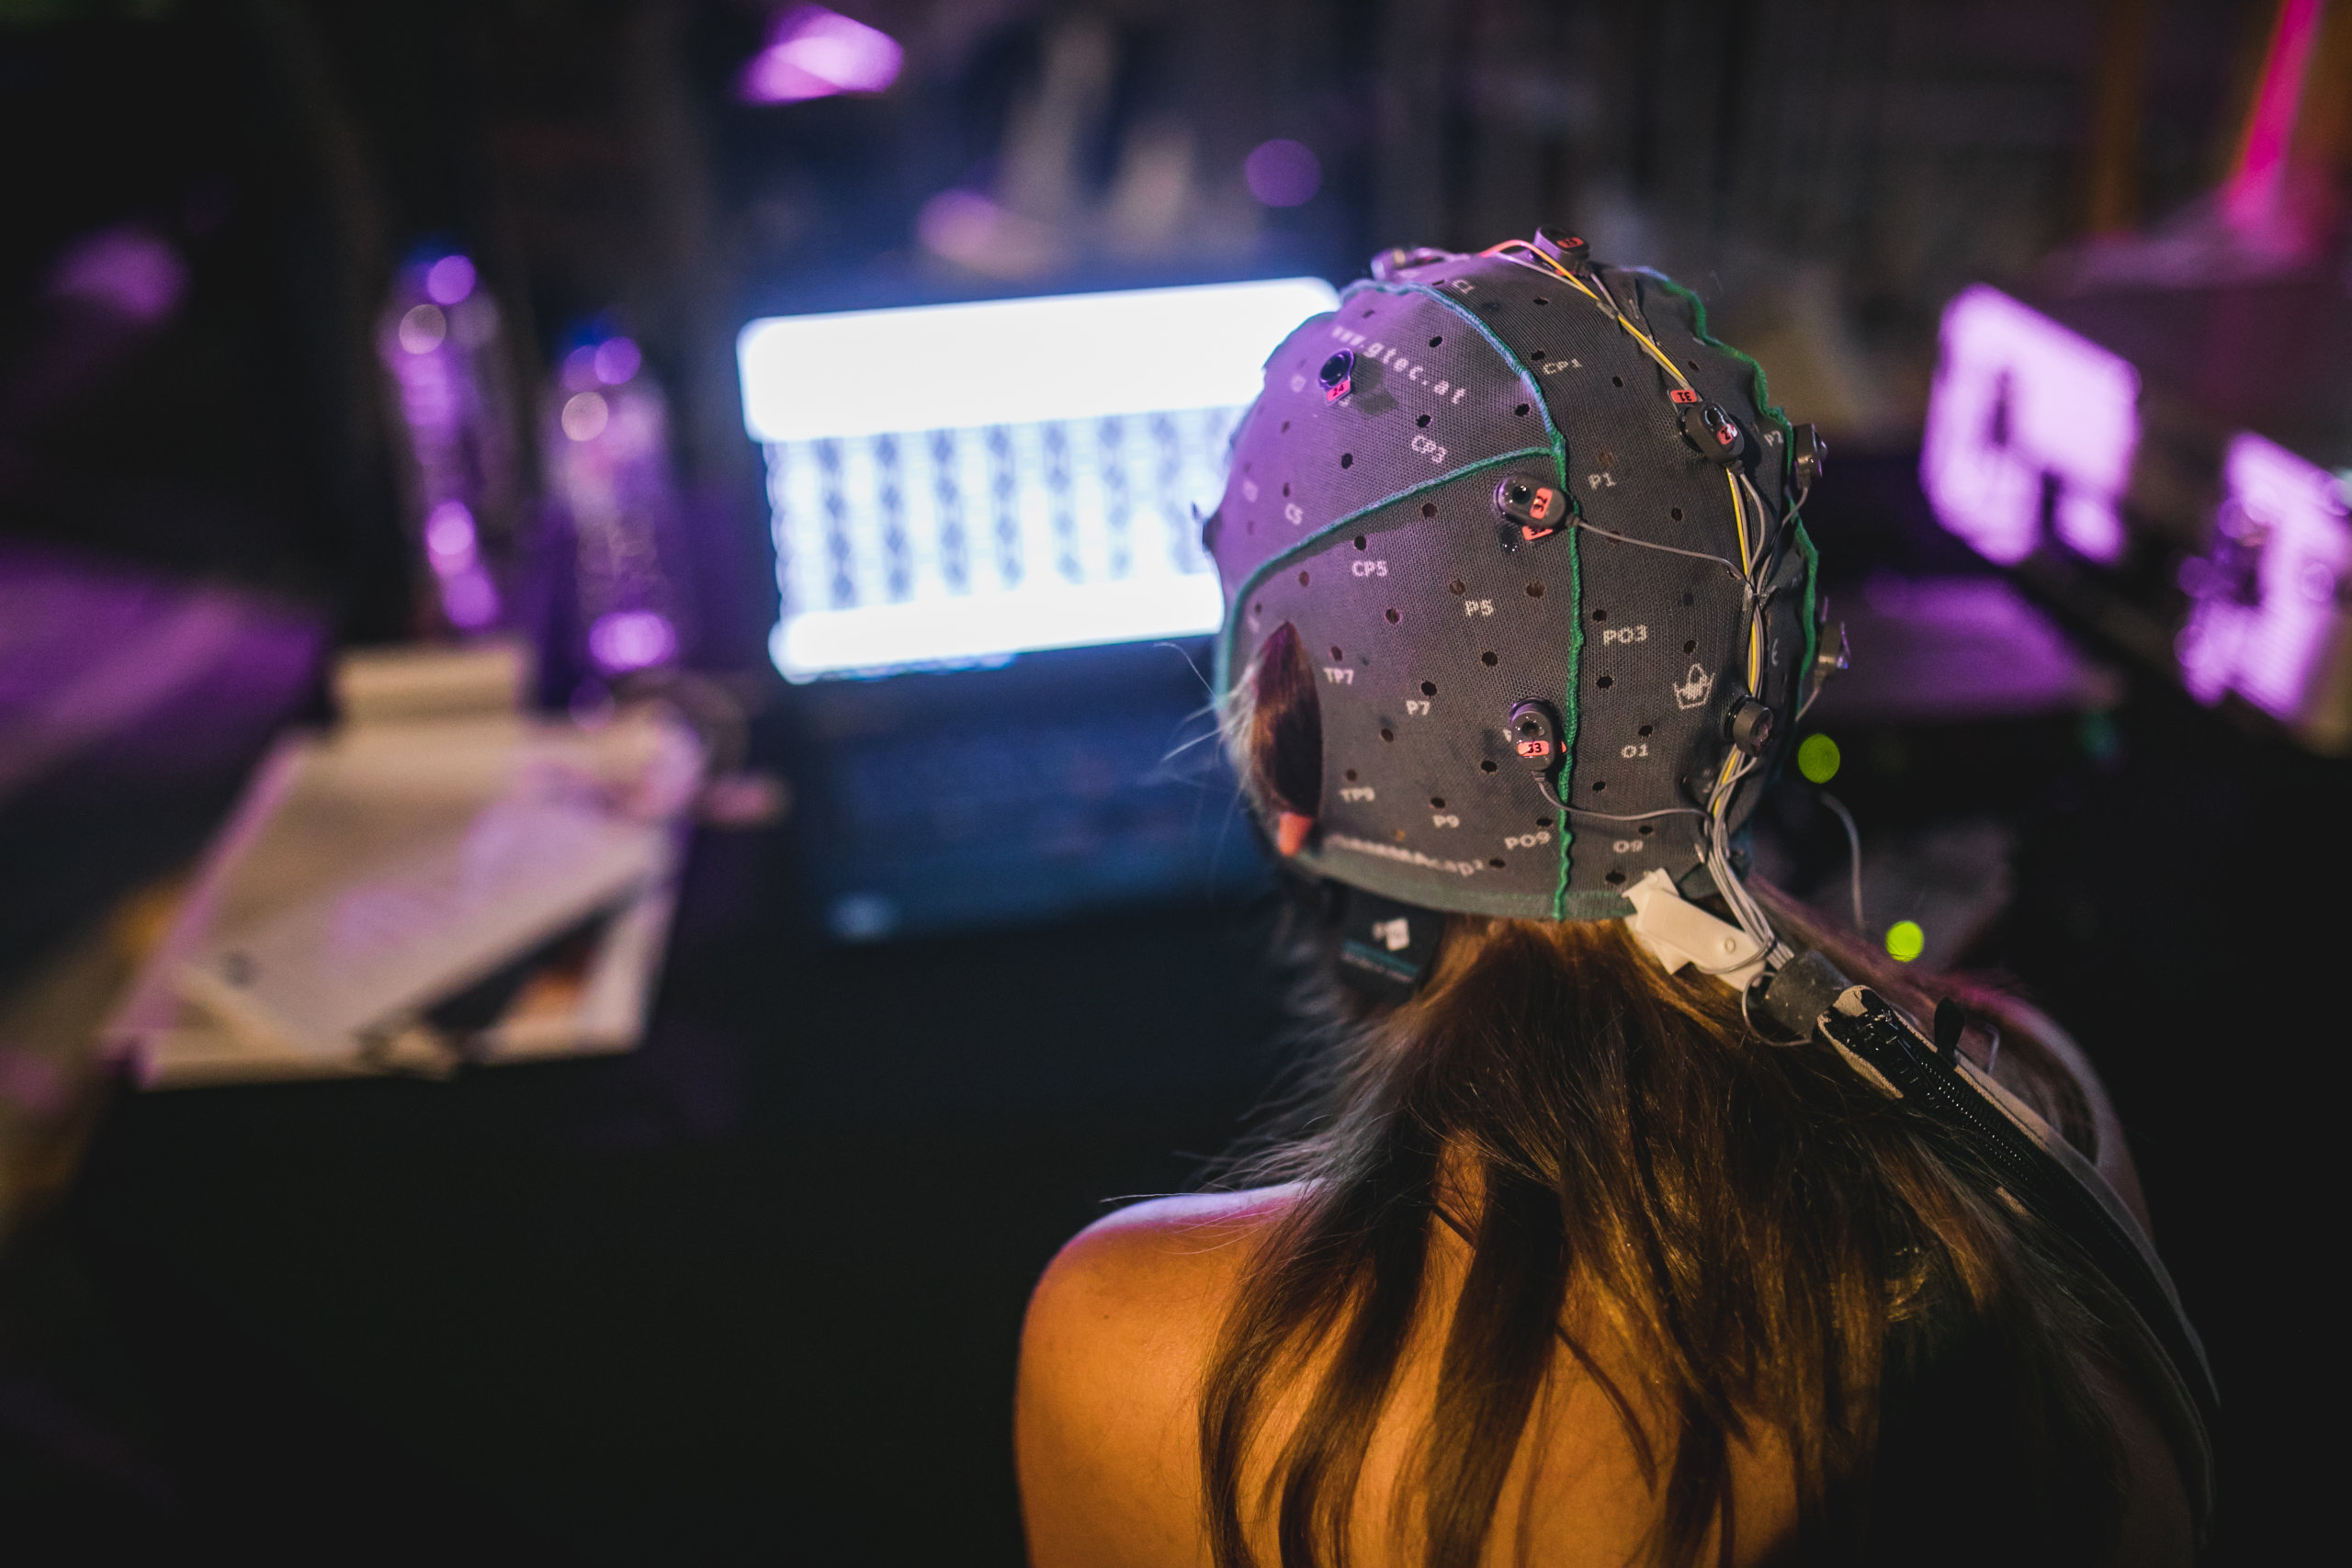
FROM BIOSIGNALS TO FEATURES & CLASSIFICATION
Turn multimodal biosignal recordings into meaningful parameters for neuroscience, BCI and electrophysiology research. Extract relevant signal features and use g.BSanalyze’s integrated classification tools to distinguish classes using linear and nonlinear methods.
Combine the interactive graphical user interface with MATLAB-based customization and automation to move from visual data exploration to reproducible analysis workflows. Custom MATLAB algorithms and additional toolboxes can be integrated when required, while the standalone version of g.BSanalyze can also operate without a MATLAB installation. MATLAB is required for batch processing directly from the MATLAB command environment.
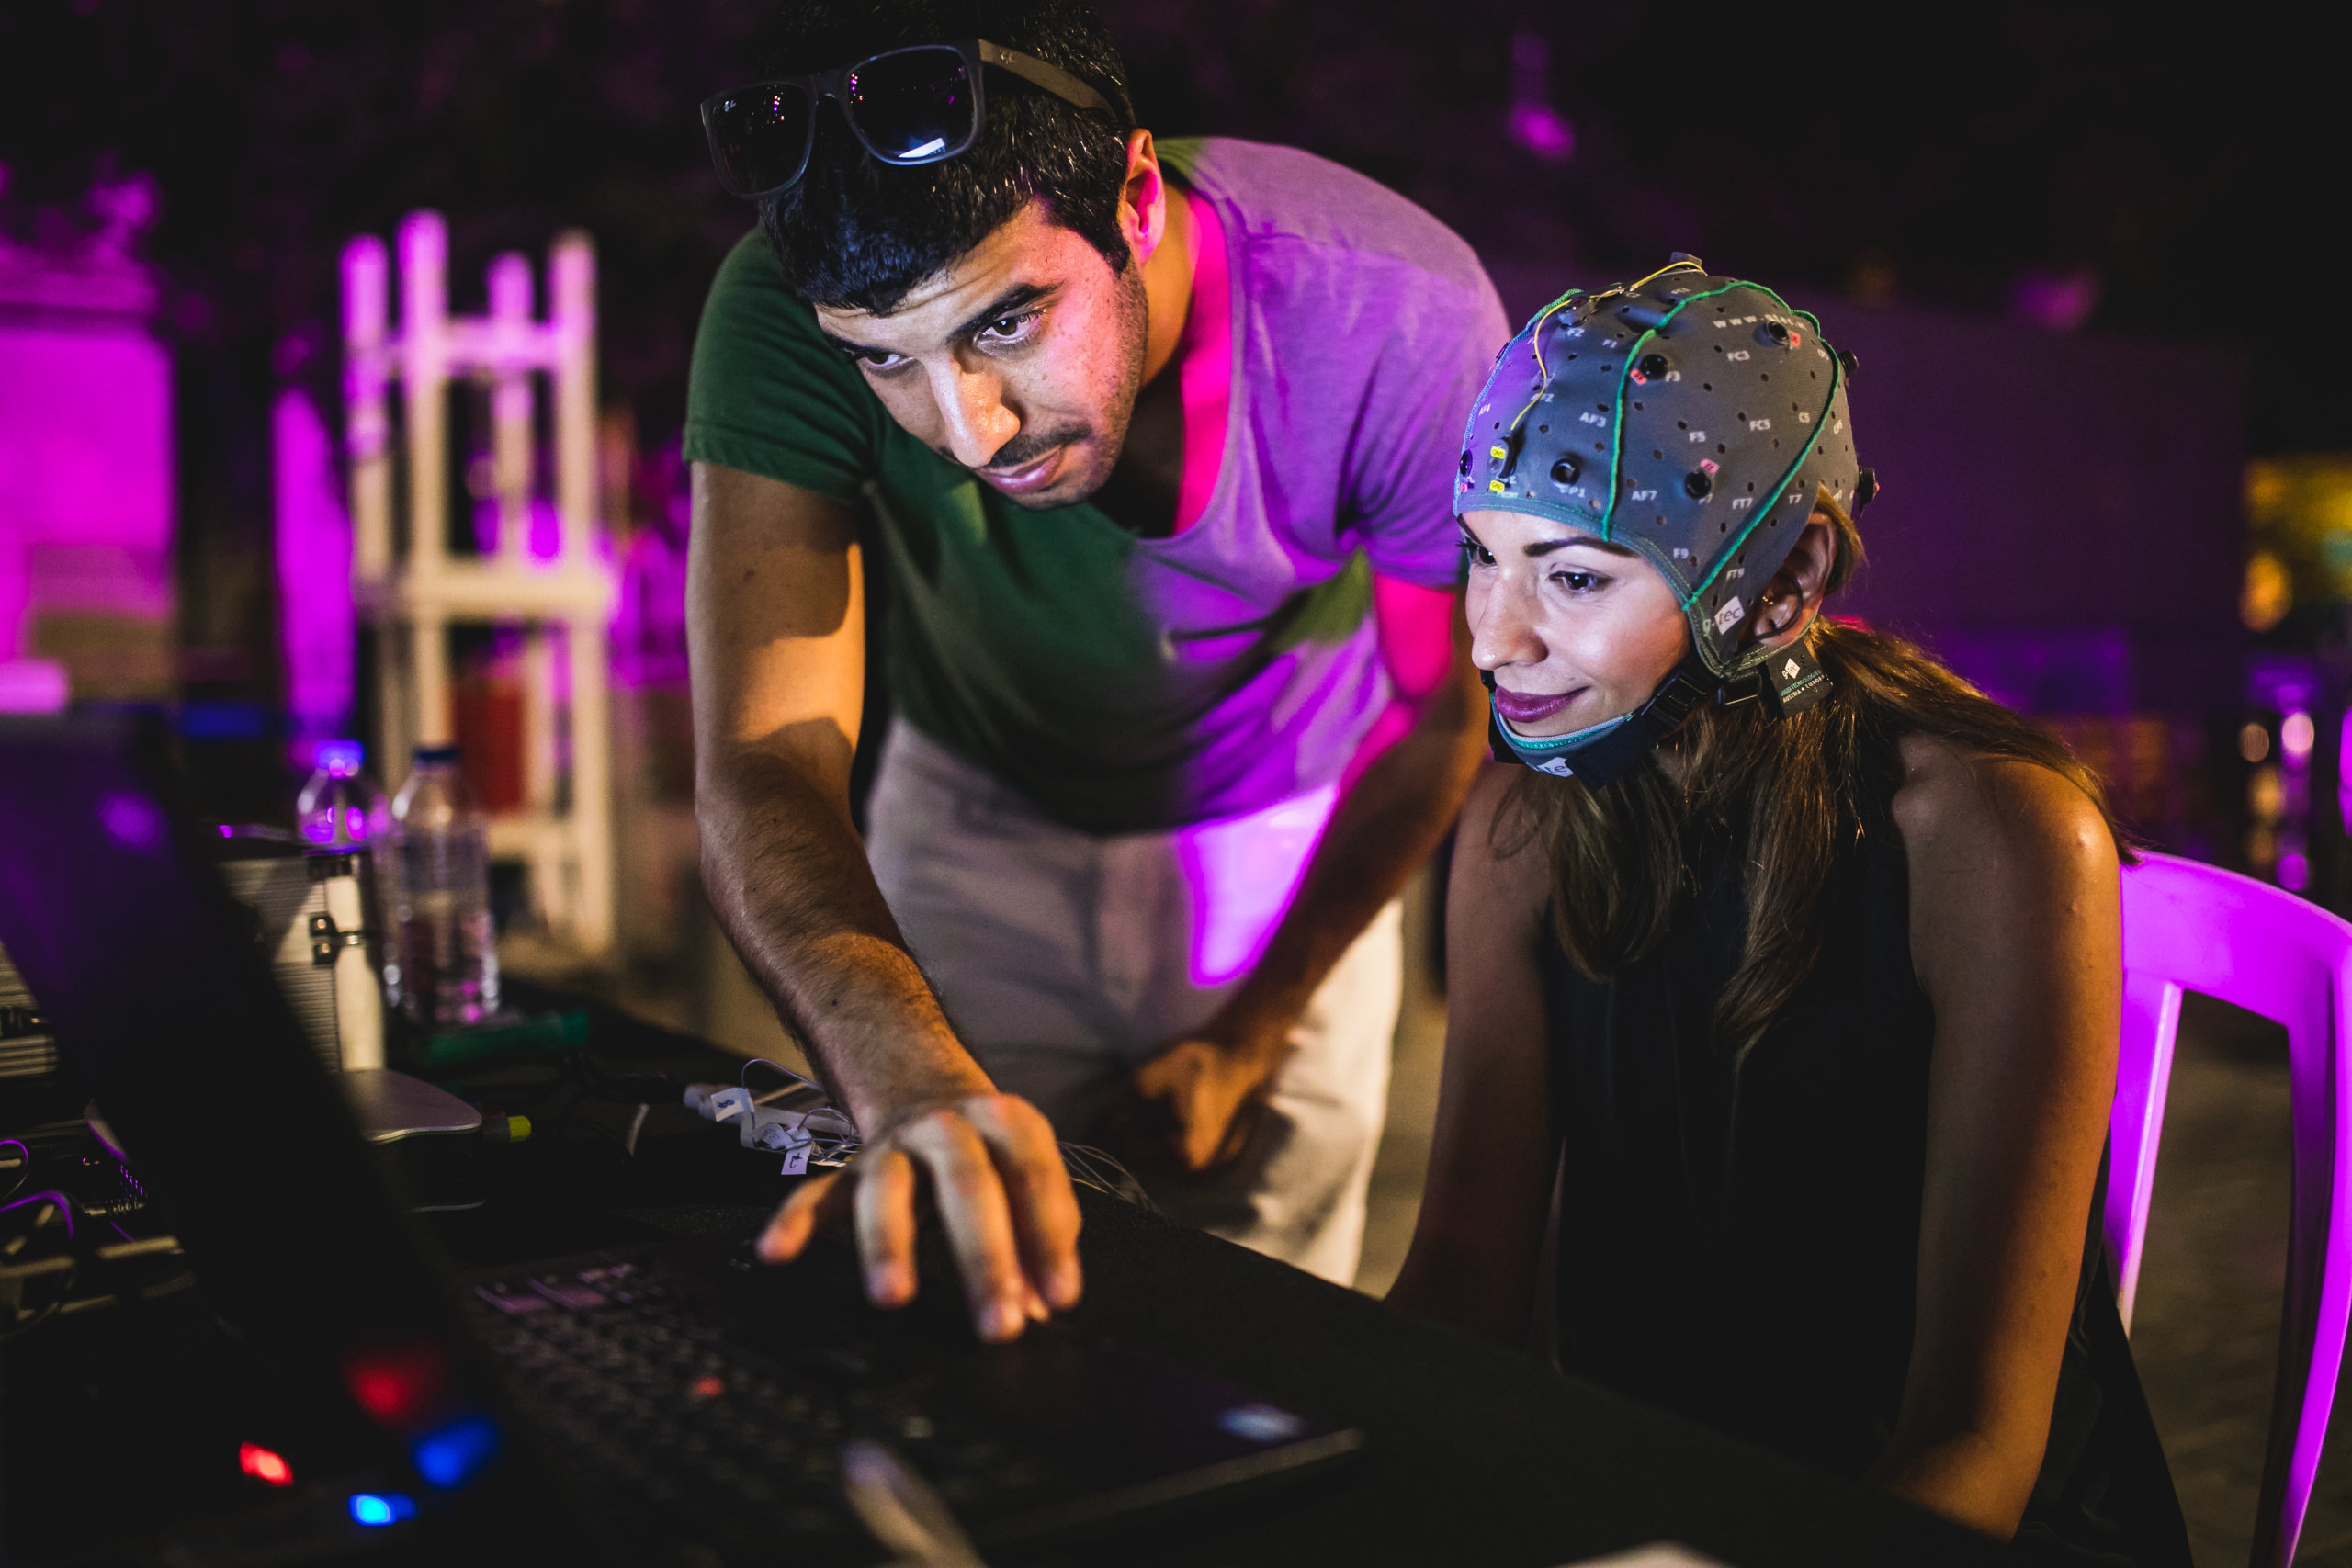
FROM BIOSIGNAL DATA TO REPRODUCIBLE RESEARCH WORKFLOWS
g.BSanalyze combines interactive biosignal analysis with customizable and reproducible workflows in one environment. Work with recorded EEG, ECoG, ECG, EMG, EOG, spike and physiological data, define your own analysis pipeline, and move from visual exploration to automated MATLAB-based batch processing.
Dedicated tools for ERP, ERD/ERS, CSP, P300, SSVEP/SSSEP, TMS-EEG and BCI classification support neuroscience and BCI research, while OSCAR PRO, ICA, spatial filtering and TMS artifact removal provide advanced options for offline artifact correction.
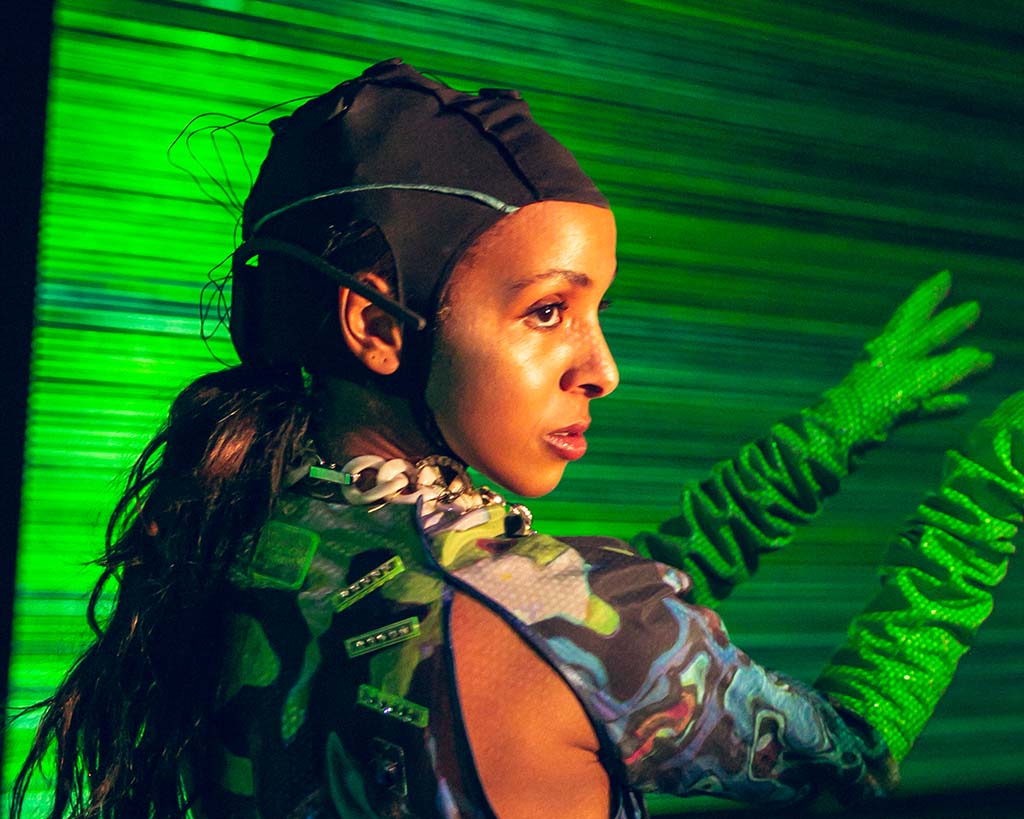

OSCAR PRO: OFFLINE EEG ARTIFACT CORRECTION
EEG recordings can be affected by eye movements, muscle activity, body movement and other physiological or technical artifacts. OSCAR PRO provides offline artifact correction for recorded EEG data, complementing g.BSanalyze’s additional artifact-processing tools including ICA, spatial filters, automatic artifact detection and dedicated TMS discharge artifact removal.
For experiments requiring artifact correction during acquisition, OSCAR LIVE is included in g.HIsys Professional, while OSCAR PRO is included in g.BSanalyze Professional for offline analysis.
INTERACTIVE ANALYSIS & AUTOMATED MATLAB WORKFLOWS
Use g.BSanalyze through its interactive graphical user interface for visual exploration and analysis, or build automated workflows for processing multiple datasets.
Integrate your own algorithms and additional MATLAB toolboxes, save processing steps, and run analyses in batch mode for scalable and reproducible data processing. The standalone version can be used without a MATLAB installation, while batch processing from the MATLAB command environment requires MATLAB.


FROM BIOSIGNAL DATA TO REPRODUCIBLE SCIENTIFIC ANALYSIS
g.BSanalyze provides a complete offline workflow from data import and preprocessing to artifact correction, signal analysis and visualization. Import recordings from g.tec applications and supported third-party formats including MATLAB, EDF, CNT, BIOPAC, MICROMED and BioSemi.
Prepare and inspect your data with filtering, resampling, baseline correction, spatial filtering, signal quality assessment and data transformation. Correct artifacts using automatic detection, ICA, spatial filters, OSCAR PRO for offline EEG artifact correction, and dedicated TMS discharge artifact removal.
Apply ICA, PCA, single-trial and event-related analyses, visualize and inspect your results, and save processing workflows for automated batch analysis across multiple datasets.
As part of the g.tec BCI platform, g.BSanalyze connects with g.HIsys, g.Recorder and g.NEEDaccess APIs, while g.tec Suite 2024 manages installation, updates and software compatibility.
GENERAL BIOSIGNAL ANALYSIS & VISUALIZATION
Explore, quantify and visualize biosignal data with tools for signal quality assessment, evoked potential analysis, spectral and wavelet analysis, parameter extraction and topographic visualization. g.BSanalyze supports the workflow from data inspection to research-relevant signal parameters and scientific results.
Assess data quality, average trials for EP analysis, calculate power spectra, SNR and statistical differences, and perform wavelet analyses. Extract parameters including bandpower, signal variance and adaptive autoregressive (AAR) features, cross-correlation and minimum energy.
Create 2D plots and topographic maps, and define electrode montages using the international 10–20 system or custom layouts, including BIP, CAR, LAR and LAP source derivations. Paradigm information created with Paradigm Presenter in g.HIsys can also be imported for subsequent offline analysis.


ECG & HEART RATE VARIABILITY ANALYSIS
Analyze ECG recordings and quantify heart rate (HR) and heart rate variability (HRV) across time, frequency and time-frequency domains. g.BSanalyze combines automatic R-peak detection with comprehensive HRV analysis, parameter extraction and event-related ECG analysis.
Calculate time-domain and frequency-domain HRV parameters, RR interval measures, geometric and segmented measures, power and normalized measures, and visualize results using Poincaré plots and HRV time-frequency maps. Generate tachograms, analyze coherence and event-related coherence, and investigate event-related ECG changes.
Automatic QRS/R-peak detection and marker assignment supports efficient processing and subsequent analysis of ECG recordings.
EEG, BCI & EVENT-RELATED ANALYSIS
Analyze EEG data with dedicated tools for coherence, event-related activity, ERD/ERS, time-frequency analysis, evoked potentials and BCI research. g.BSanalyze supports ERD/ERS analysis with significance testing and time-frequency mapping using bootstrap statistics, complex demodulation, wavelets and Hilbert transformation.
Investigate neural activity using Common Spatial Patterns (CSP), phase-locking value, mean frequency and statistical comparison between classes, and calculate evoked potentials including ASSR, MNN, BAEP, P300 and N400.
For EEG quality and artifact processing, the toolbox includes OSCAR PRO offline artifact correction and TMS artifact removal. Additional parameter extraction includes Hjorth and Barlow parameters, running fractal dimension, temporal and spatial complexity, minimum-energy analysis for SSVEP/SSSEP-based BCIs, and P300 BCI accuracy.

FEATURE EXTRACTION & CLASSIFICATION FOR BCI AND BIOSIGNAL DATA
Turn extracted biosignal features into data-driven classifications for BCI, neuroscience and electrophysiology research. g.BSanalyze provides tools to generate feature matrices, train and test classifiers, apply classification models to recorded datasets, and visualize the resulting classifications.
Choose from linear and nonlinear methods including multi-class LDA, SVM, backpropagation neural networks, radial basis functions, DSLVQ, K-means clustering and minimum-distance classification, as well as ROC analysis, majority voting and P300 accuracy calculation.
Generate feature matrices from complete datasets or selected time segments and store trained classifiers for subsequent online applications, including BCI and biofeedback systems.
CEREBRAL FUNCTION MONITORING & NEONATAL EEG ANALYSIS
Analyze neonatal EEG and amplitude-integrated EEG (aEEG/CFM) offline with dedicated tools for visual inspection and automated classification. g.BSanalyze can calculate CFM signals from selected EEG segments and display the resulting traces for detailed review.
Automatically segment and classify CFM traces into predefined patterns including continuous voltage pattern (CVP), discontinuous low and high voltage patterns (DLVP/DHVP), isoelectric pattern (ISO), burst suppression pattern (BSP), and bursts. Classification criteria can be adjusted to support specific applications, recording conditions or derivation techniques.
HIGH-RESOLUTION EEG & ANATOMICAL MAPPING
Analyze and visualize high-resolution EEG data using spatial processing and realistic anatomical models. g.BSanalyze supports high-resolution spline Laplacian derivations for applications including ERD/ERS and ERP analysis.
Generate realistic multi-layer anatomical models from segmented CT or MRI data, fit electrode positions to individual models, and edit geometry information. Map analysis results onto different anatomical layers using 2D and 3D visualization, with adjustable transparency and colors, free model rotation, and time-series generation.
SPIKE & NEURONAL ACTIVITY ANALYSIS
Analyze neuronal firing activity together with behavioral and spatial data using dedicated tools for spike and position analysis. g.BSanalyze supports firing-rate analysis and peri-stimulus time histograms (PSTH) to investigate neuronal responses and identify active regions.
Combine neural activity with speed and position data to analyze movement trajectories, visits, class probabilities and dwell times. Calculate spatial parameters including firing fields, Skaggs index, spatial coherence, spatial selectivity, mean non-zero firing rate, and maximum and minimum activity.
ECoG & CCEP ANALYSIS FOR INTRACRANIAL EEG
Analyze ECoG recordings and cortico-cortical evoked potentials (CCEPs) with dedicated tools for intracranial electrophysiology. The CCEP toolbox calculates evoked responses from ECoG recordings and combines them with electrode montage and stimulation information for spatial interpretation.
Import electrode locations from existing montages or define them manually, identify stimulation channels, stimulation current, triggers and trials, and visualize CCEP responses directly across the electrode montage. Processing options include referencing, channel exclusion, detrending, line-noise cancellation, even/odd trial separation and standard-error visualization to assess response consistency. Multiple CCEP views can be created and exported for further analysis and reporting.

PART OF THE G.TEC SOFTWARE ECOSYSTEM
g.BSanalyze is the offline analysis environment within g.tec Suite 2024, which combines g.NEEDaccess, g.HIsys, g.Recorder and g.BSanalyze in one software ecosystem. The Suite simplifies installation, updates and software compatibility across g.tec applications.
Researchers can acquire and process biosignals in real time with g.HIsys, record experimental data with g.Recorder, and perform advanced offline analysis with g.BSanalyze. g.NEEDaccess provides access to APIs and interfaces for custom software development, creating an integrated workflow from data acquisition and recording to real-time processing and offline scientific analysis.
OFFLINE EEG DATA ANALYSIS
See how g.BSanalyze transforms recorded EEG and multimodal biosignal data into meaningful analysis results. This presentation introduces the software’s core capabilities for feature extraction, parameter definition and offline signal processing.
g.BSanalyze can operate as a standalone application without MATLAB, while MATLAB enables additional command-line batch processing for automated analysis workflows.

OFFLINE ERP DATA ANALYSIS
Learn how to perform a complete offline ERP analysis workflow with g.BSanalyze, from data preprocessing to statistical analysis and scientific visualization.
This tutorial demonstrates how researchers can process recorded EEG data, analyze event-related potentials (ERPs), compare results statistically and visualize the resulting brain responses within g.BSanalyze.

OSCAR PRO: ARTIFACT REMOVAL FOR EEG & ECoG
See how OSCAR LIVE and OSCAR PRO reduce artifacts in EEG and ECoG recordings while preserving the underlying neural information. The presentation covers artifacts caused by eye blinks, eye movements, muscle activity, body movement and other physiological or technical sources, including a live demonstration, validation results and the impact of artifact correction on BCI performance.
OSCAR LIVE is included in g.HIsys Professional for real-time artifact correction, while OSCAR PRO is included in g.BSanalyze Professional for offline artifact correction of recorded data.
FREQUENTLY ASKED QUESTIONS
Yes. Customers purchasing a g.tec biosignal amplifier can receive discounts on selected g.tec software packages.
When purchasing a g.HIamp, g.USBamp or g.Nautilus, the following discounts apply:
- g.tec Suite 2024: 80% discount
- g.BSanalyze: 50% discount
- g.HIsys Basic: 5% discount
- g.HIsys Professional: 10% discount
- g.Recorder Basic: 5% discount
- g.Recorder Professional: 10% discount
When purchasing a Unicorn BCI Core-8, the following software packages are available with the amplifier:
- g.tec Suite 2024: 80% discount
- g.HIsys Basic: 5% discount
- g.HIsys Professional: 10% discount
- g.BSanalyze: 50% discount
g.Recorder Basic and g.Recorder Professional are not offered as software options with Unicorn BCI Core-8.
Yes. g.BSanalyze is designed for offline analysis of recorded EEG, ECoG and multimodal biosignal data. Researchers can import recordings, inspect individual channels and trials, apply preprocessing and artifact correction, and perform subsequent feature extraction, statistical analysis, classification and visualization.
The software provides more than 100 functions across the time, frequency and spatial domains, including filtering, baseline correction, spatial filtering, spectral analysis, coherence, ERP/EP analysis, ERD/ERS, time-frequency analysis and classification. This allows researchers to define their own analysis workflow rather than being limited to a fixed processing pipeline.
Yes. A key advantage of g.BSanalyze is the combination of a graphical analysis environment with MATLAB-based customization. Researchers can interactively explore and process data through the GUI while also integrating their own MATLAB algorithms and compatible MATLAB toolboxes.
Processing steps can be saved and reused for automated batch processing, making it possible to move from interactive exploration to reproducible processing of larger datasets. A standalone version is also available without MATLAB, although batch processing directly from the MATLAB command environment requires MATLAB.
Analysis does not have to be repeated manually for every recording. Processing steps can be saved and subsequently applied to multiple datasets using g.BSanalyze batch processing.
This is particularly useful for studies with many subjects or sessions where the same preprocessing, feature extraction and analysis pipeline needs to be applied consistently. Researchers can begin interactively, verify the processing workflow visually, and then automate repetitive analysis steps using MATLAB-based batch processing.
g.BSanalyze provides several approaches to artifact processing rather than relying on a single method. These include OSCAR PRO for offline EEG artifact correction, ICA, spatial filtering, automatic artifact detection and dedicated TMS artifact removal. Researchers can therefore select artifact-processing methods according to the recording and experimental paradigm.
For experiments that require artifact correction during acquisition rather than afterwards, OSCAR LIVE is included in g.HIsys Professional, while OSCAR PRO is included in g.BSanalyze Professional for offline artifact correction.
Yes. g.BSanalyze includes dedicated functionality for TMS discharge artifact removal followed by offline EEG processing and analysis. This enables researchers to continue from TMS-EEG recordings into preprocessing, evoked-response analysis, spectral analysis and visualization within the same analysis environment.
Within the wider g.tec workflow, TMS events and EEG recordings can be brought into g.BSanalyze for subsequent offline analysis, connecting acquisition and event information with the analysis workflow.
g.BSanalyze supports analysis workflows for major BCI paradigms including motor imagery, P300, SSVEP/SSSEP, cVEP and slow cortical potentials. Available methods include ERP analysis, ERD/ERS, Common Spatial Patterns (CSP), spectral and time-frequency analysis, feature extraction and classification.
Its classification tools include linear and nonlinear approaches such as multi-class LDA, SVM, neural networks, radial basis functions, DSLVQ, K-means clustering and minimum-distance classification. Researchers can generate feature matrices, train and evaluate classifiers and store trained classifiers for subsequent online applications.
Yes. g.BSanalyze is not restricted to EEG. It supports offline processing and analysis of EEG, ECoG, ECG, EMG, EOG, spikes and other physiological signals, allowing brain and body signals to be investigated within the same analysis environment.
Dedicated toolboxes extend the environment for EEG, ECoG, CCEP, ECG, high-resolution EEG, cerebral function analysis, spike analysis and classification. This is particularly useful for multimodal neuroscience and electrophysiology experiments where different biosignals need to be evaluated within a common analysis workflow.
Yes. g.BSanalyze can analyze recordings from g.Recorder, g.HIsys, MATLAB and supported third-party data sources. Supported import formats include MATLAB, EDF, ASCII, CNT, BIOPAC, BioSemi and Micromed, alongside additional supported formats.
This means researchers are not limited to recordings acquired with a single g.tec amplifier. Existing datasets and recordings from supported third-party systems can be incorporated into g.BSanalyze analysis workflows.
Yes. g.BSanalyze provides 2D and 3D scientific visualization, including topographic mapping and high-resolution EEG visualization. The High-Resolution EEG toolbox supports spline Laplacian derivations and the generation of realistic anatomical multi-layer models from segmented CT or MRI data.
Researchers can fit electrode positions to anatomical models, edit geometry information and map analysis results onto different model layers. Results can be visualized in 2D and 3D, with adjustable transparency and colors, free model rotation and time-series generation.
g.BSanalyze is the offline analysis component of the g.tec neuroscience software ecosystem, rather than an isolated analysis program. Researchers can use g.Recorder for biosignal recording, g.HIsys Professional for real-time acquisition and processing, and g.BSanalyze Professional for advanced offline analysis and OSCAR PRO artifact correction.
These tools are part of the broader g.tec Suite 2024 software environment, which also includes g.NEEDaccess APIs and manages software installation, updates and compatibility. This creates an integrated workflow spanning biosignal acquisition, recording, real-time processing, offline analysis and custom research applications.
NEED MORE INFORMATION
ABOUT THIS PRODUCT?
Send us your email so we can contact you as soon as possible.


